Introduction
The purpose of these notes is to present some facts about the campaign to stop global warming and climate change. The climate has changed in the past, is probably changing now, and will change in the future. The campaign is trying to stop the unstoppable.
The natural factors affecting global temperature are very powerful: terrestrial, solar, galactic, and cosmic. Although the manmade contribution to CO2 levels in the atmosphere is claimed to be substantial it is actually very very small (00.0024% of the atmosphere) and the effect on temperature will be minimal.
1. There are 5 organisations which monitor global temperatures:
Terrestrial: GISS Goddard Institute of Space Studies. Part of NASA.; NOAA National Oceanic and Aerospace Administration (USA).; HADCRUT Climatic Research Unit, UK Met Office.
Satellite
RSS Remote Sensing Systems. USA. UAH University of Alabama, Huntsville. They all produce slightly different figures. The terrestrial ones have been "homogenising" the figures i.e. adjusting the recent temperatures upwards and older data downwards for years. I prefer to use the satellite data which is more reliable.
2. Revealing statements from the Intergovernmental Panel on Climate Change (IPCC).
In 2007 the IPCC Assessment Report 4 contained the following statement in the chapter by Working Group 1 : " The climate system is a coupled non-linear chaotic system and therefore the long term prediction of future climate states is not possible"
And it was further confirmed in 2010 by Ottmar Edenhofer Chairman of the UN – IPCC Working Group 3 who said " One must say clearly that we redistribute de-facto the world's wealth by climate policy..... One has to free oneself from the illusion that international climate policy is environmental policy. This has almost nothing to do with environmental policy any more". (link in http://bit.ly/2QaeDsr). When it became clear during the temperature pause, 1999 onwards, that the forecasts were not supported by the empirical data, Professor Chris Holland of the Hadley Centre for Climate Prediction and Research said: "The data doesn't matter. We are not basing our recommendations on the data. We are basing them on the climate models." Refer to note 16 for model reliability. Such quotes are never mentioned in the news media.
3. Carbon Dioxide
CO2 in the atmosphere has recently been increasing by about 2 molecules per million molecules (00.0002%) per year and now stands at about 410 molecules per 1,000,000 molecules (00.04%). This is expressed as parts per million by volume (ppmv) . I prefer to express it in terms of 10,000 molecules of atmosphere. In 1900 the volume of CO2 in the atmosphere was 3 molecules in 10,000 molecules; in 2020 it was 4 molecules in 10,000; that is an increase of 1 molecule in 10,000 in a period of 120 years and that extra 1 molecule is alleged to have caused the global warming (0.8C). Is the climate of the world so delicately balanced that a change of 1 molecule in 10,000 can cause dangerous global warming? CO2 can warm the atmosphere - but not much. These facts are never mentioned in the news media.
The graph below (derived from GWPF 2.3.21) shows the increase of CO2 of 2 ppmv per year and demonstrates the increase of one molecule in 10,000 over a period of 62 years.
4. The warming effect of CO2 is logarithmically reducing
This means that as more and more gets into the atmosphere the additional CO2 has less and less effect. As we are now at 410 molecules per million any additional CO2 will have only marginal effect. (see paper by Dr. David Archibald available at http://wattsupwiththat.com /2010/03/08/the-logarithmic-effect-of-carbon-dioxide). See the graph below. As to whether the hypothesis that manmade CO2 is having any significant effect is correct - well you can see that the answer is probably no. This is never reported in the news media.
The point is that any extra CO2 introduced into the atmosphere now will have no effect on global warming. (Archibald,D, 2007)
5. Measurement of CO2
Since 1958 this has been done by the laboratory at Moana Loa, Hawaii using infrared spectroscopy. Between 1812 and 1961 it was done in various laboratories around the world using the Pettenkofer method. In those 149 years this gave results varying from 270 ppmv to 440ppmv (1. Beck,E 2007, Energy and Environment 18: p259-282; 2. Plimer, Heaven and Earth p 416). See the graph below. The IPCC have ignored without explanation the thousands of measurements using the Pettenkofer method with the variable results shown below except to take the lowest figure of 270 ppmv as the pre industrial era level which, apparently, is reliable while rejecting the figures of 440 ppmv in 1825 and 1940 as not reliable. Since 1958 the Moana Loa results show a consistent rise of about 2 ppmv per year. The laboratory is situated near the top of one of the largest volcanoes on earth surrounded by the warm Pacific Ocean. Volcanoes emit large quantities of CO2 and warm seas degas large quantities of CO2 also. Professor Ian Plimer states that over 80% of Moana Loa measurements are dismissed as poor data – i.e. non conforming.
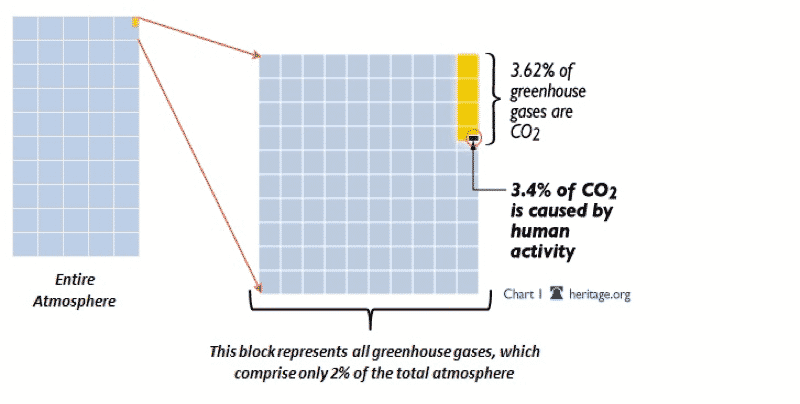
The above graph shows determination of atmospheric CO2 by 1. The Pettenkofer method (solid line of 5 year averages), 2. Interpretations of atmospheric CO2 from Antarctic ice cores (gas chromatography) 3. Edited measurements of atmospheric CO2 from Moana Loa (infrared spectroscopy 1958 and onwards) One method of measurement shows great variability in atmospheric CO2 yet another method does not. Graph derived from Professor Plimer's book "Heaven and Earth" page 420. The following diagram shows CO2 as a proportion of the atmosphere and as a percentage of the greenhouse gases, and the percentage created by man (Dr. Tim Ball www.technocracy.news.com). 2% x 3.62% x 3.4% = 00.0024%
So forecasting man's effect on future climate in terms of doubling total CO2 is factually dishonest.
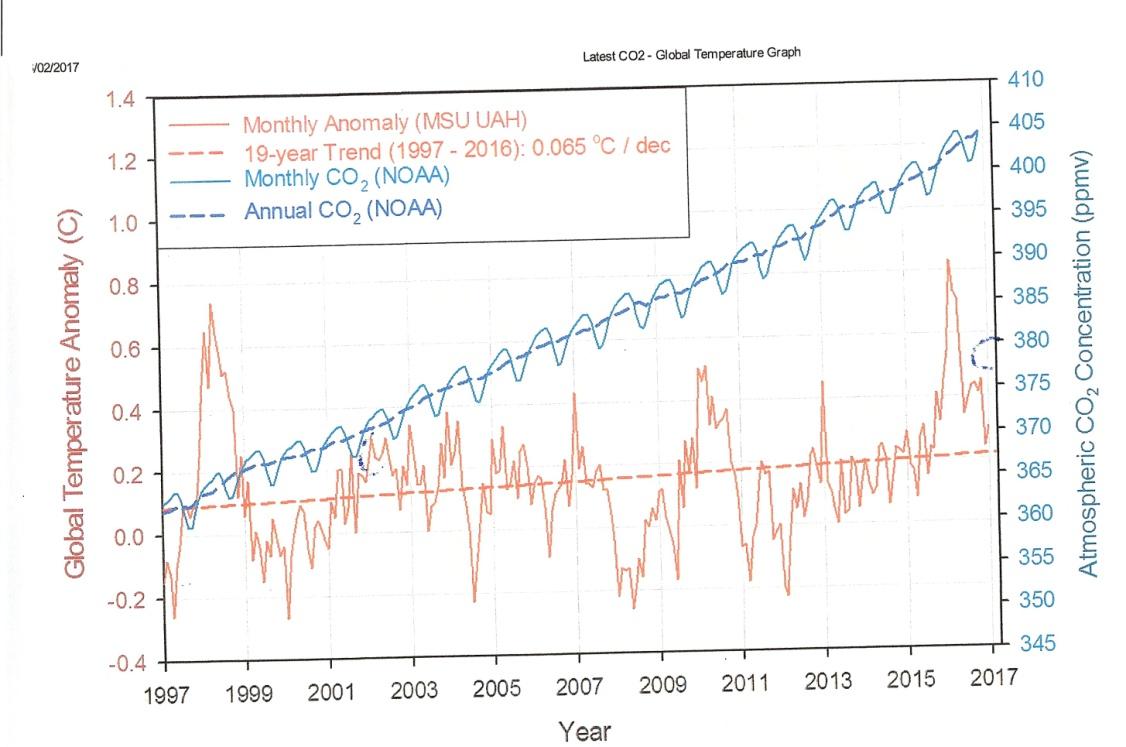
6. Growth in CO2 compared with global temperature
It is interesting to note that the increase in CO2 (derived from NOAA via Moana Loa) shows an increase of 2 parts per million per year.. Compare this with paragraph 12 below , which shows the CO2 emissions increase per year in million metric tonnes. This calculated tremendous growth has had no impact on the annual growth measured by NOAA.
7. The life of CO2 in the atmosphere is short
There are 37 scientific papers which have examined the life of CO2 in the atmosphere. In 35 of them the findings varied between 3 years and 7 years. One of them found 25 years (Suess&Lal 1983). One of them found in excess of 100 years. The Intergovernmental Panel on Climate Change (IPCC) chooses to take 100 years . This is never mentioned in the news media.
8. Methane is widely claimed to be significant in global warming as it is 20 times more effective than CO2
Its volume in the atmosphere is about 1,800 molecules per billion i.e. less than 2 molecules per million. Yes, like CO2 it can warm the atmosphere but not much. What is more, methane quickly and spontaneously oxidises into CO2 and water. (Plimer, "Heaven and Earth" page 183). This is never reported in the news media.
9. Water vapour is the main warming gas and forms 95% of all the warming gases
Water vapour is beyond the control of man. Water vapour has a substantial warming effect. Interestingly water vapour in the form of clouds has both a warming and a cooling effect. The net effect varies due to the nature of clouds. This is never mentioned in the news media.
10. There is one factor which destroys the CO2 hypothesis
The most fundamental assumption of the hypothesis is that an increase in CO2 will cause an increase in temperature. This assumption is programmed into the computer models and has a compound effect on forecasts. In fact every record for any period of geological time and duration shows that exactly the opposite happens – temperature increases before CO2. (Professor Tim Ball, Phd. The Corruption of Climate Science, page 162.) This fact is never mentioned by the IPCC or reported in the news media.
11. Between 1885 and 2016 the global temperature anomalies varied a little up and down with cold and warm spells
From 1885 to 1916 the temperature was falling slightly; from 1916 to 1940 it was rising slightly; from 1940 to 1975 it was falling slightly; from 1975 to 1998 rising slightly; 1998 to 2020 there has been no statistically significant change. This is shown in the graph below derived from www.WeatherWatch.co.uk, temperature Fahrenheit.
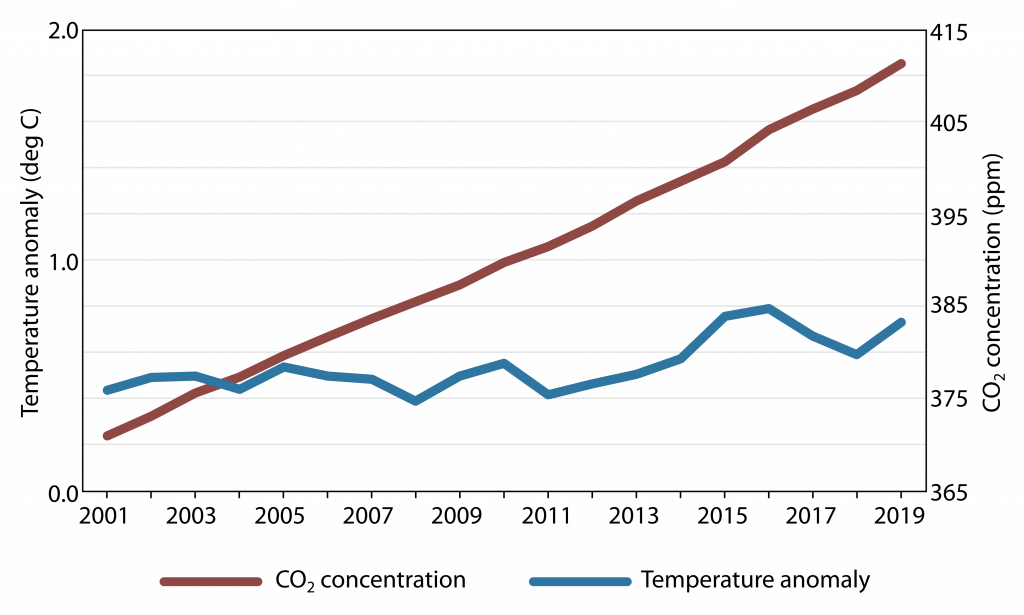
The graph below shows global temperature anomalies 1998 to 2019 published by GWPF January 2020. You can see that there is no correlation between CO2 and temperature.
According to the laboratory at Moana Loa during most of those 138 years the level of CO2 consistently rose and the hypothesis that CO2 creates dangerous global warming was formulated in the period 1975 to 1998. However, you can see that for 53 of those years the global temperature was rising and for 85 of those years it was falling or steady. Why did the temperature fall when CO2 was rising? These temperature changes can only be seen if measured in tenths of a degree This is never reported in the news media.
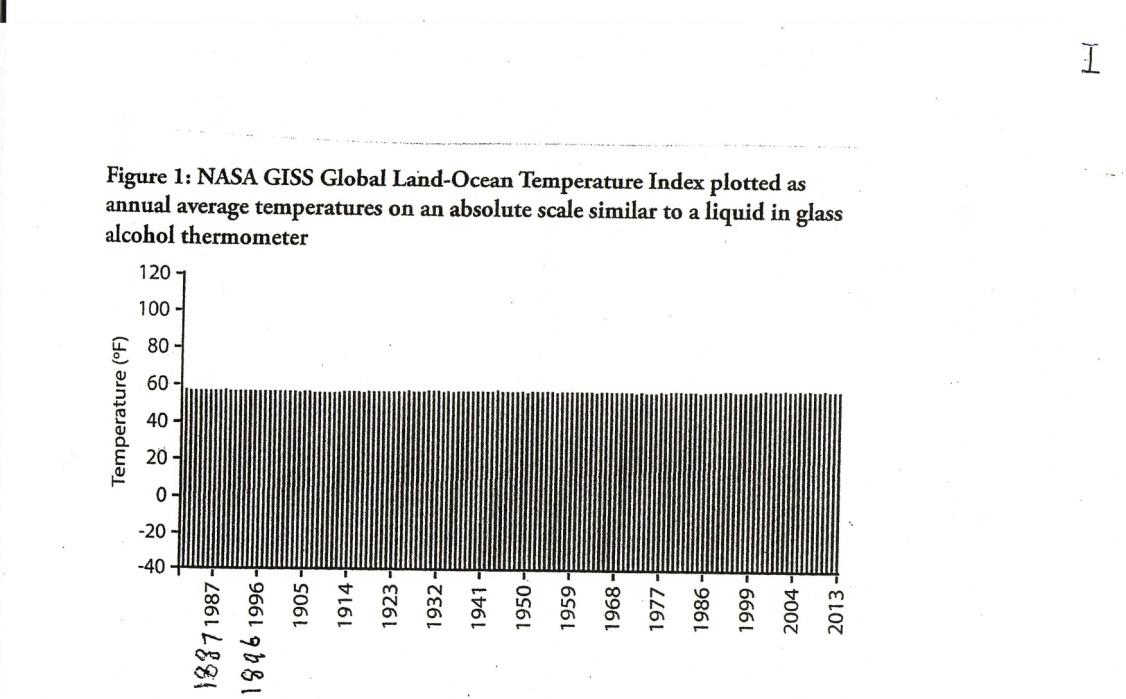
The graph below produced by Anthony Watts (WUWT) shows the changes in global temperature since 1887 converted to a normal wall mounted domestic thermometer.
Source: Plot of NASA GISS global average surface temperature from 1880 to 2013, with thanks to James Sexton for conversion assistance. Data derived from "Global Land-Ocean Temperature Index in 0.01 degrees Celsius, base period: 1951- 1980", National Aeronautics and Space Administration accessed 10th July 2014 http://data.giss.nasa.gov/gistemp/table.data_v3/GLB.tstdSSTtxt
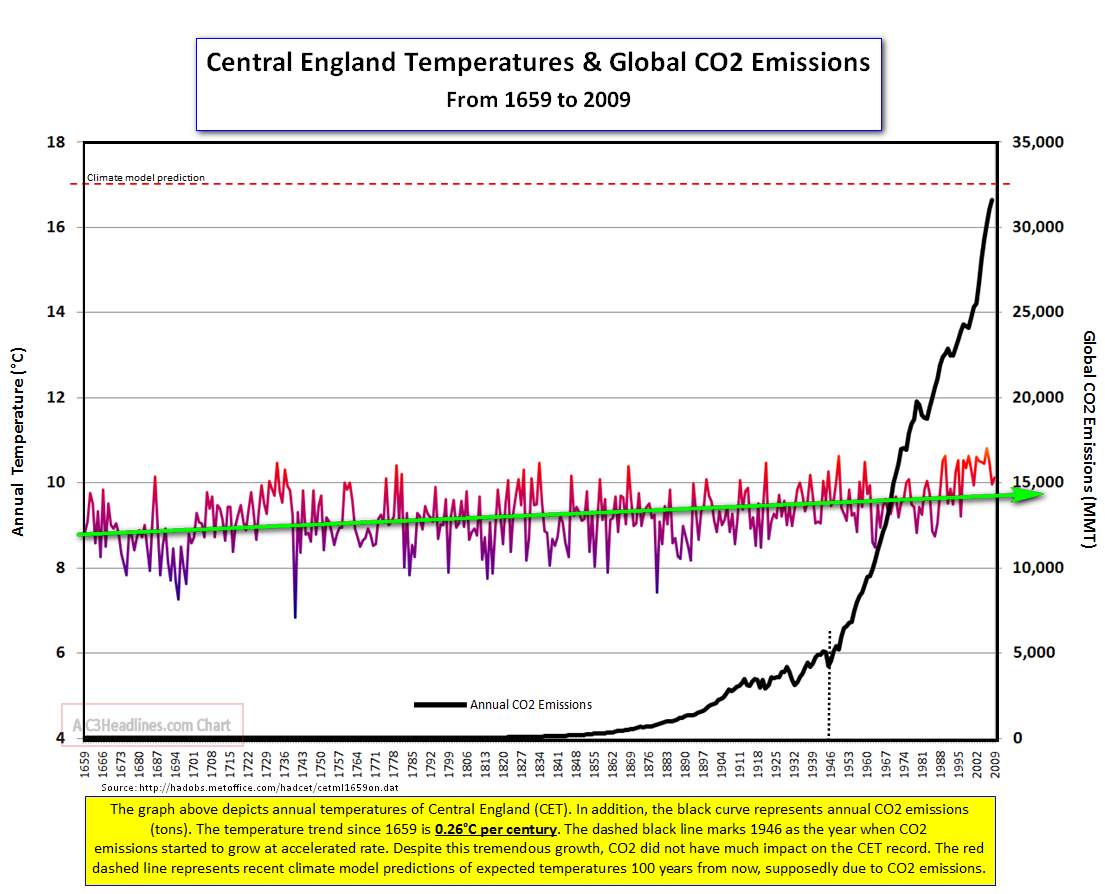
12. It is clear that global temperatures have risen irregularly since the Little Ice Age (at its coldest 1645 to 1715) when rivers in Europe including the Thames were regularly frozen over.
The global temperature has risen at a rate of about 0.3C per hundred years since then. The Central England Temperature (CET) from 1659 (see graph below) shows a rise of approximately 1 degree centigrade. The graph also shows the lack of correlation between CO2 and temperature. Most of that time man produced very little CO2. Natural forces are at work. You can see that warming from 1694 to 1730 was similar to 1988 to 2005. It is interesting to also note that the temperature recorded in 1730 was the same as that recorded in 2008. Until the effect of natural causes of global warming or cooling is established it is impossible to establish the extent of warming caused by manmade CO2 emissions. If any. None of this is ever mentioned in the news media.
13 The reduction in the number of weather stations.
The graph below derived from the National Oceanic and Atmospheric Administration (USA) shows the reduction in the number of weather stations.
Fig. 5 : Evolution of land stations and global temperature. Beginning of 1990, thousands of meteo stations located in cooler rural zones (e.g. Siberia, North Canada) stopped recording data (source :ftp://ftp.ncdc.noaa.gov/pub/data:ghcn/v2/v2.temperature.readme).
The above graph shows a reduction of approximately 8000 weather reporting stations and the effect on global temperature which has created a false warming. This is never mentioned in the Assessment Reports of the IPCC. Nor is it reported in the news media.
14. What of the future?
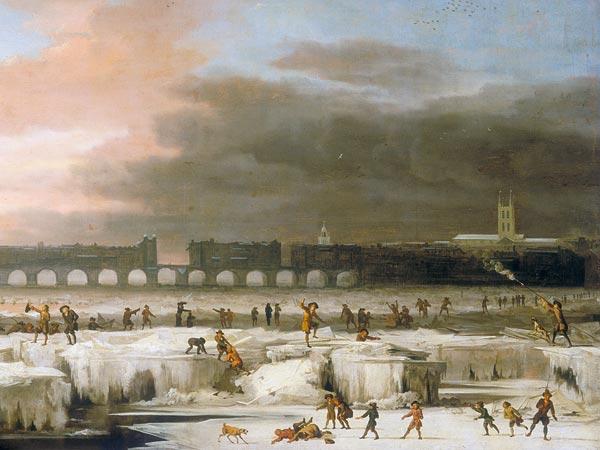
Many climate scientists believe that the earth is about to enter a 30 year period of cooling based upon the present low number of sunspots. Records of sunspots show that periods of low sunspots correlate with periods of low temperature (see below). Both NASA and NOAA have forecast that solar cycle 25 will be the lowest for 200 years. If global temperatures fall to the levels experienced in Solar Cycle 5 during which the Thames froze over at Westminster in 1814 and 1816 the implication is widespread crop failures. No Western government is making preparations for this.This is never reported in the news media.
The above painting by Abraham Hondius shows the frozen Thames in 1677.
Daily observations of sunspot numbers from 1st January 1977. Source WDC-SILSO, Royal Observ. Belgium.
The Maunder Minimum coincided with the Little Ice Age; The Dalton Minimum was another period of intense cold during which the Thames froze over in London in 1816. If the prediction by NASA is correct similar cold temperatures can be expected. The major effect will be widespread crop failures.
The graph below gives the temperature on the Greenland ice sheet during the last 10,000 years derived from the Greenland Ice Sheet Project 2 (GISP2) ice core. Data source from Joannanova.com.au. The direction of the trend is clear.
Professor Henrick Svensmark of the Danish National Space Institute has demonstrated the connection between sunspots and climate identifying that the flow of cosmic rays varies with the number of sunspots. A low number of sunspots allows more cosmic rays to penetrate earth's atmosphere. A high number of sunspots reduces them. Cosmic rays ultimately develop into nuclei from which rain drops form thus forming clouds. Most clouds cool the earth. Thus low sunspots allow more clouds to form leading to periods of colder climate. This process was confirmed by experiments at CERN.
15. Climate Cycles
Many astronomers and other scientists have determined that climate changes in regular cycles. Research done by Dr. Theodor Landscheit starting in 1976 and studies by Fairbridge and Sanders (Columbia University) show that our climate varies – warm to cold, cold to warm – in cycles about every 180 years giving a double cycle of 360 years. It is thought that this is due to the sun's motion about the centre of the solar system. Research by Dr. Paul Mayewski on the Greenland Ice Sheet has identified a 1440 year cycle (Journal of Geophysical Research, 30.11.1997) of intensely cold climate which has also been identified in North Atlantic deep sea cores by Bond et al (Science, 14.11.1997). From these cycles it can be deduced that the 360 year cycle, and the 1440 year cycle are due to coincide early in the 21st century. Add to this that the last serious ice age occurred about 11,500 years ago (1440x8) and it looks possible that we are in for serious cooling followed by catastrophic cooling in the not too distant future. No government is considering this.
16. The forecasts of Catastrophic Anthropogenic Global Warming
Due to increasing CO2 in the atmosphere use computer models which have been severely criticised by sceptical scientists. See the graph below. Until the proportion of CO2 created by natural factors is known the proportion created by man must be unknown. This is never reported in the news media.
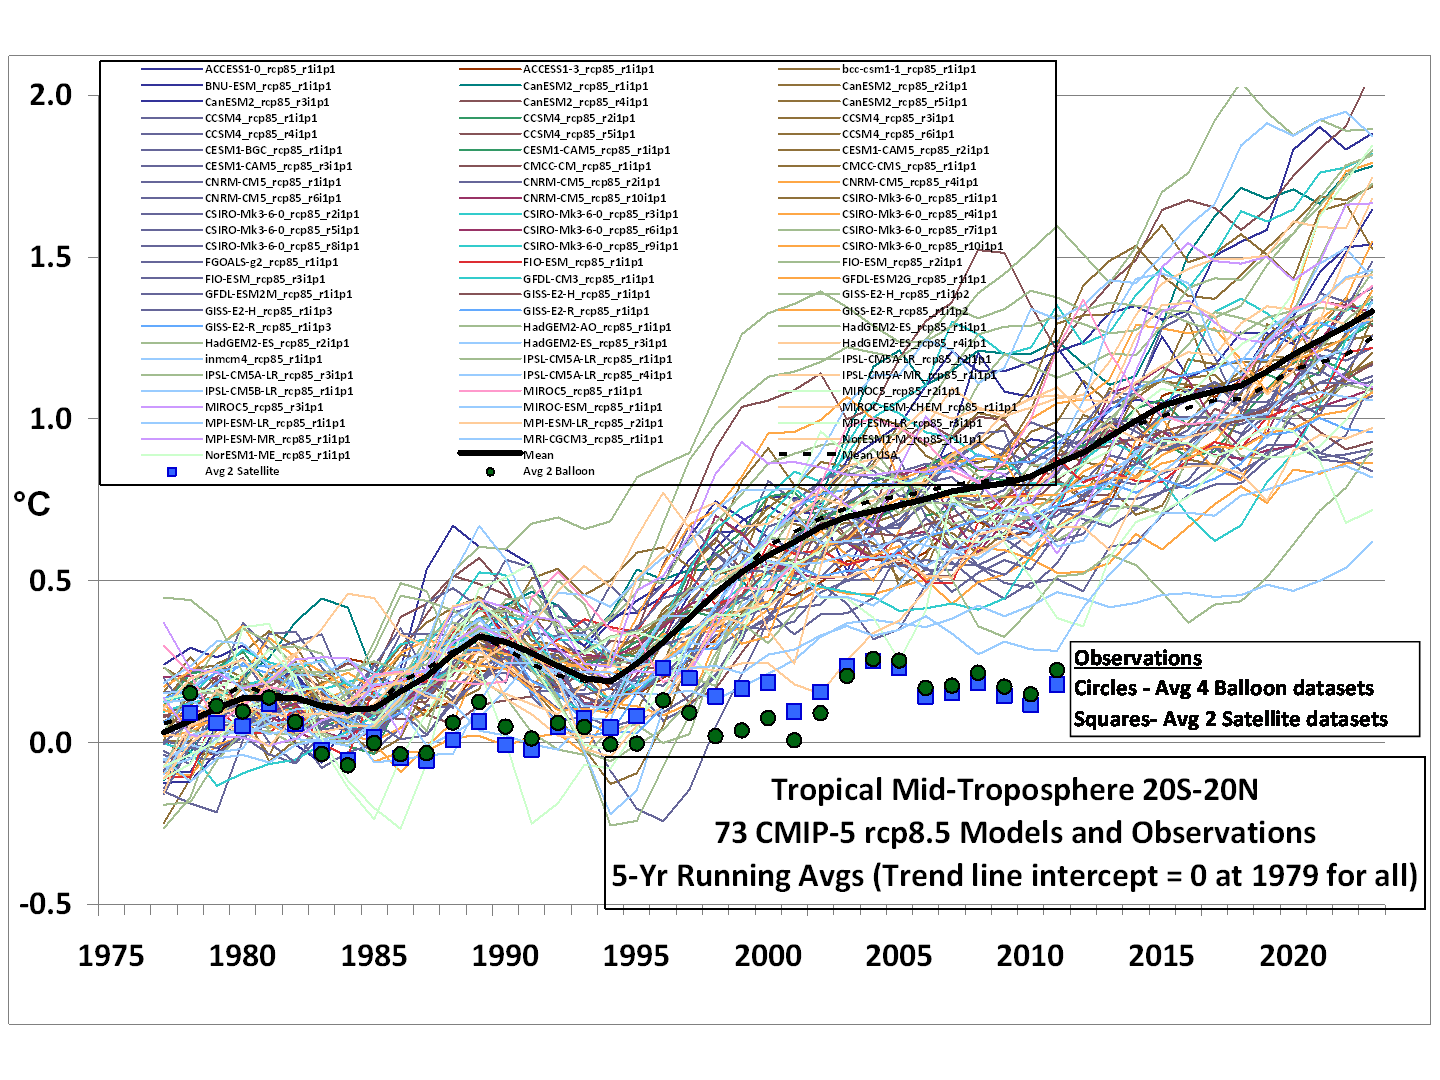
17. Computer model forecasts
These indicate an increase in global temperature of between 2 C and 6C by the year 2100. The forecasts of 73 models, upon which the IPCC relies for its Assessment Reports, are given below compared with actual observations of global temperatures 1976 to 2012. This is never reported in the news media.
A similar graph can be found in the IPCC Assessment Report AR5 Technical Summary figure TS-14 with the following discussion in box TS3: " However, an analysis of the full suite of CMIP5 (Coupled Model Intercomparison Project) historical simulations....reveals that 111 out of 114 realisations show a GMST (Global Mean Surface Temperature) trend over 1998 – 2012 that is higher than the entire HADCRUT4 trend ensemble (box TS3 figure 1a; CMIP5 ensemble mean trend is 0.21C per decade). This difference between simulated and observed trends could be caused by some combination of (a) internal climate variability, (b) missing or incorrect RF, and (c) model response error." GWPF 6.11.19
18. The Great Barrier Reef, Australia.
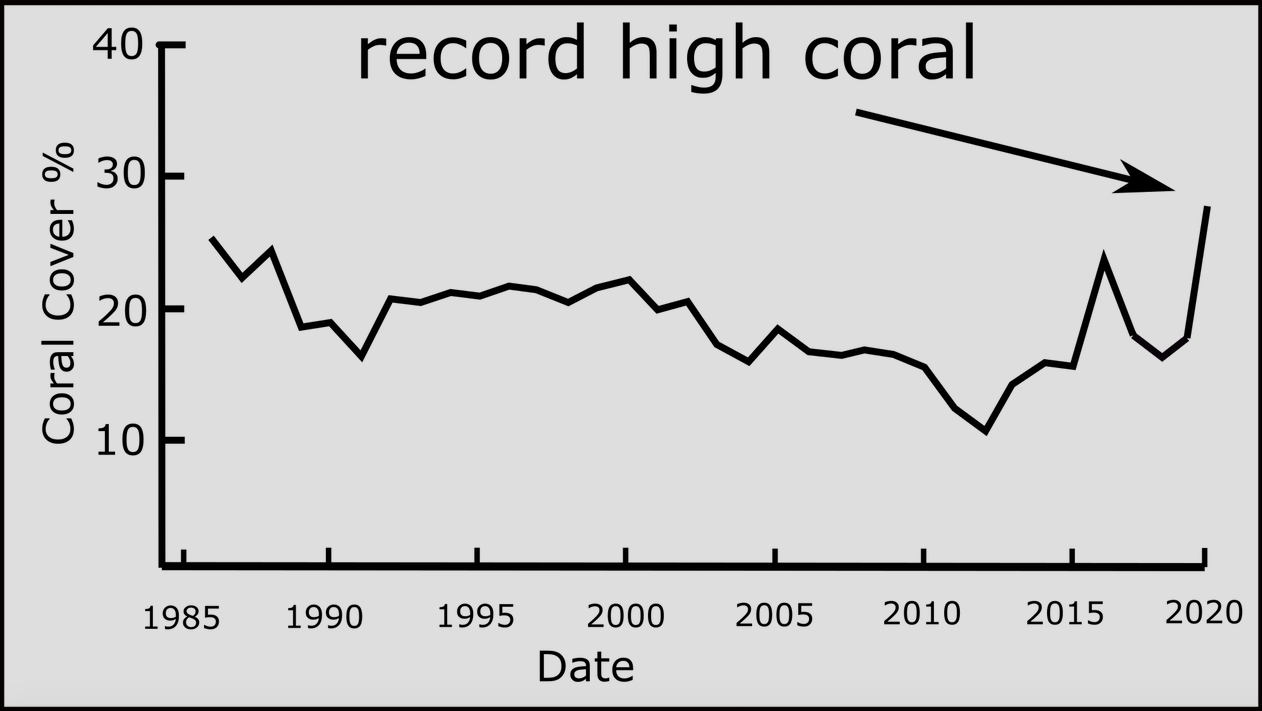
At a lecture in the House of Lords on 4.11.2019 Dr.Peter Ridd, who has spent 35 years studying the reef, presented the following: 'Many of the threats to the Great Barrier Reef, such as from sediments and nutrients from agricultural runoff, and from climate change (either natural or manmade), have been greatly exaggerated. Far from being in very poor condition, the GBR is actually one of the most pristine and unspoiled ecosystems on earth. The manifest discrepancy between alarmist claims and observational evidence is due to a systemic failure of Quality Assurance systems used for science and relied upon for public policy decisions.' This was not reported in the news media. Coral consists of an animal called a polyp which has a symbiotic relationship with the many varieties of phytoplankton. Each polyp selects which plankton to ingest and the plankton protects the polyp from grazers. In periods of colder or warmer seawater the polyps eject the plankton and it becomes white. Although this is called "bleaching" the coral is not dead but is dormant until new plankton is ingested. Scientists and the media have made little or no effort to disclose this truth. (Patrick Moore, Fake Catastrophes, page 22). Dr. Peter Ridd says just about every area of the Great Barrier Reef "has completely recovered" since the 2016 bleaching event and is in "no danger". (GWPF 21.6.21). On 21.9.21 the UN World Heritage Committee decided that in view of the high level of corals existing on the GBR it should not be put on the In Danger List.
This data series, which started in 1985, is taken from the Australian Institute of Marine Science yearly long term monitoring of the Reef. Source:Dr. Peter Ridd
19. 2014: the Warmest Year Ever
The terrestrial record (GISS, NOAA, and HADCRUT) give this impression. The graph on paragraph 13 shows that between 1990 and 2000 approximately 8000 weather stations were removed from the record. These were mainly rural stations which experience cooler temperatures than urban stations because of the Urban Heat Island effect. If RSS and UAH satellite figures are used (which are far more comprehensive) 2014 turns out to have been cooler than several other years in the last 18. This is compounded with the fact that the terrestrial data records have been altered to raise modern temperatures and reduce historical temperatures (1. Report by Iowa Climate Science Education 06.April 21; 2. GWPF News 02 July 19). This is never reported in the news media.
20. Global Sea Ice
Arctic sea ice and Antarctic sea ice are seasonal. Arctic ice has slowly declined in area for 30 years but in September 2018, was 470,000 square miles (1.2 million sq kilometres) more than it was in 2012. This is more than the area of France, Germany, and Italy combined and illustrates the variability of the arctic ice.
The above graph shows the annual minimum September monthly average sea ice extent in the Northern Hemisphere from 2007 through 2019 according to two different data sets: Sea Ice Index (SII) from NOAA and Multisensor Analyzed Sea Ice Extent (MASIE) from NIC (USA National Ice Centre). The chart begins with 2007 ending a decadal decline and beginning 12 years of stochastic instabilities around a plateau. The linear trend lines are flat for both indices. The volume of ice in the Arctic has no pattern and the SII figure for 30th Sept 2020 is 4.25 million square kilometres. Although this is low it is equal to the combined areas of 22 European states and the trend shown above is not significantly affected.
With regard to Antarctic sea ice January is the Antarctic summer and sea ice extent in 2020 is at the 1979- 1990 average. According to USA National Sea Ice Data Centre the Jan 2020 extent exceeded the level of 16 of the years since 1980. So for 40 years Antarctic sea ice has been variable and is now (2020) higher than it was in 1980. This is never reported in the news media.
21. Polar Bear population is sparsely spread over the Arctic
The International Union for the Conservation of Nature (IUCN) in 1966 estimated that only 10,000 polar bears remained. In 2006 IUCN estimated that the population had increased to 25,000. In 2017 the number of bears is close to 30,000. Polar bear population depends on the availability of baby seals. So lack of summer sea ice is irrelevant. This is never reported in the news media.
22. Hurricanes
Frequency and intensity is measured using the Accumulated Cyclone Energy Index (ACE). In the last 30 years there has been a steady decline in the number and strength of hurricanes and cyclones which continues into 2020. On a scale of 1 - 5 in the last 10 years only 3 of strength 3 or higher have reached land in the USA. See the graph below.
Global hurricane frequency 38 years. Top line is the number of hurricanes exceeding 64 knots – steady decline over 38 years. Bottom line is number exceeding 96 knots – no significant increase. In that period CO2 increased by approx. 76 ppmv. And the temperature anomaly by 0.2 C. It is reasonable to conclude that there is no direct connection between CO2, temperature anomaly, and hurricanes.
It should be noted that a recent paper by Dr. Knutsford of NASA included a graph showing that the number of hurricanes had no trend up or down from 1880 to 2020.
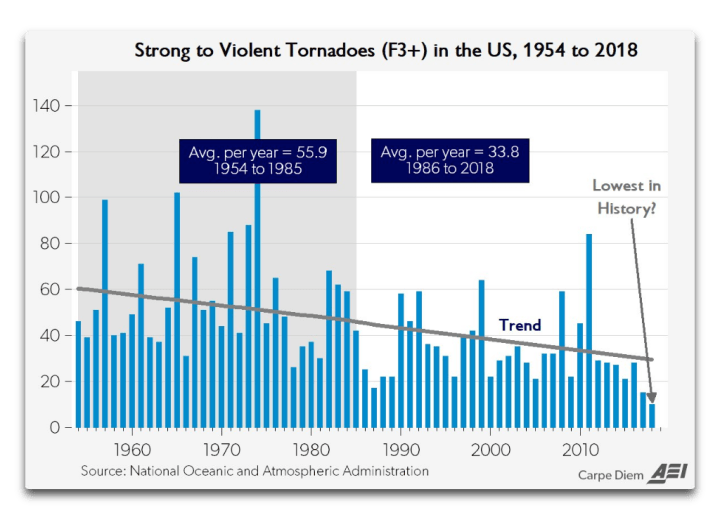
23. Tornadoes
These have been declining in frequency since 1954. The numbers are stochastically irregular but the trend is clearly downwards at present.
The following chart is derived from Watts up with That 29 5 21. From NOAA data.
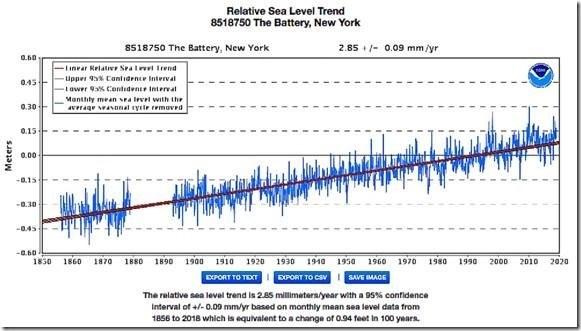
24. Sea Level
The factors affecting sea level are complex: geological, sea temperature causing expansion, and land ice melt. In the last 100 years global sea level has risen by approx. 8 inches. The current rate of increase is about 2 - 3 mm a year and this will cause a rise of about 12 inches by 2100 AD, adaptation is the best approach not the reduction of CO2 in the atmosphere. The first graph below shows average sea level at New York 1830 to 2019. The second graph shows average sea level at San Francisco 1980 to 2014.
MDuring the period 1980 to 2014 CO2 in the atmosphere increased by approximately 20% (Moana Loa)
25. Islands in the Pacific and Indian Oceans
A 20 year study published in 2018 has revealed that atolls and low lying islands in the Pacific and Indian Oceans are not at as much risk as has been thought. 709 islands were studied looking at data from the 1940s and it was found that no atoll lost land area and that 88.6% of islands were either stable or increased in area while only 11.4 % contracted. (GWPF 29.11.20)
26. Carbon Dioxide is plant food
Plants grow by photosynthesis, using water, sunlight, chlorophyll, and CO2 . CO2 is plant food without which there would be no life on earth – it is one of the basics of the food chain and if it falls below 250 molecules per million, plants will struggle to grow. If it falls below 150 molecules per million then vegetation growth is likely to cease.
27. CO2 warming – No Basis in Science
To establish a theory in science it is necessary to follow the Scientific Method. This requires experimental work and the publishing of a paper including all the detailed workings setting out the hypothesis. Other scientists test the hypothesis or compare it with actual observations. If the hypothesis is validated it is accepted as a theory – until someone else disproves it. No laboratory experiment has ever proved that CO2 has the capacity to substantially warm the atmosphere. The New Zealand Climate Science Coalition has offered a $NZ10,000 prize to the first person to prove that man made CO2 can cause dangerous global warming. Similarly, Professor Peter Ward, BA,PhD, of Columbia University, USA, has offered a prize of $US10,000 for the first person to do so. Neither has ever been claimed. This is never reported in the news media.
28. Electric vehicles, legislation in Parliament
In order to unnecessarily achieve Net Zero carbon dioxide emissions and stop the unstoppable, governments have committed to banning the internal combustion engine and converting to electric vehicles by 2050. This decision was taken on the basis of an advisory paper (2019) produced by the government's Climate Change Committee (CCC). At the time the CCC refused to disclose its calculations by which it arrived at their advice that Net Zero could be achieved by 2050 at no extra cost to consumers. This was challenged by the Global Warming Policy Foundation and the CCC refused to reveal its calculations. After two years of court action The Information Tribunal forced disclosure. This has revealed that the 2019 figures misled Parliament by giving figures which were £1,800,000,000,000 understated (£60,000 per household). The CCC costings, upon which Government policy is based, were incomplete, biased, and grossly misleading. (GWPF).
29. In the case of the UK the additional electricity required will probably require the output of six additional nuclear power stations
This will involve an enormous misallocation of national resources. Furthermore in order to get that electricity to the batteries of the EVs will require the complete rewiring of the UK. Thousands of transformer stations will need upgrading; the distribution cables from the transformer stations to households will need upgrading and this will involve the digging up of almost every urban street in the UK. This will be a further misallocation of £billions of pounds of financial resources and create a massive amount of CO2. The UK government has made no plans for this. Much is being planned and not revealed. For instance from 1.5.22 residential EV chargers will be programmed so that EVs cannot be charged during mid morning and during early evening. This is never reported in the news media.
30. IPCC motivation
The terms of reference of the Intergovernmental Panel on Climate Change are to examine global warming in the light of Manmade CO2. "The role of the IPCC is to assess on a comprehensive, objective, open and transparent basis the scientific, technical and socio-economic information relevant to understanding the scientific basis of risk of human-induced climate change, its potential impacts and options for adaptation and mitigation." As a result they do not give consideration to scientific reports which identify different causes or which falsify the reports on which they base their hypothesis. A list has been compiled since 2014 by the website No Tricks Zone which details over 3000 scientific papers which express scepticism of the IPCC "science". The IPCC also, apparently, ignores inconvenient empirical evidence.
31. Their target is to reach net zero emissions by 2050
They say that net zero provides the opportunity for "intentional societal transformation" and do not hide their belief that capitalism and economic growth threaten the future of the planet. They seek to replace capitalism with top down coercive central planning on a global scale encompassing energy, manufacturing, construction, transportation, agriculture, and land use. (GWPF report 40, Rupert Darwall). Their motivation is political aiming to create a system of world government with real power using climate change as a vehicle. The whole agenda has been hijacked by extremists seeking to undermine the economy and social stability of European countries. (Dr.Peiser, GWPF 10.9.19).
32. The coming eco-dictatorship
In 2008 the UK Government established the Climate Change Committee to advise Parliament on action necessary to achieve net zero emissions by 2050. The chairman of the committee is Lord Deben (previously Mr. John Gummer MP). As reported in the journal Utility Week ,29th March 2021, he gave an address to a meeting to consider green investments in which he said "You need to have a very clear and powerful body saying what has to be done (to get to net zero by 2050), these are the priorities, and get on with it. Unless that happens this whole thing will be policy strong, policy powerful, and policy rich, but delivery poor". In other words despite the £billions thrown at it, satisfactory progress towards net zero is not being achieved and what will be necessary is a system of eco-dictatorship. Lord Deben's opinion has been supported by a senior economist at Deutsche Bank, Eric Heyman, who also warns that the policies will lead to a European mega crisis and they won't work without "a certain degree of eco-dictatorship" (Source GWPF 30.3.21). To achieve UN Agenda 21 this is, of course, exactly what the IPCC has intended since the 2009 Copenhagen Draft Treaty clause 38 was published . The details are set out in Paragraph 34 of this review.
33. The IPCC plan was revealed at the IPCC conference in Copenhagen 2009
A draft treaty (see below) was submitted for approval by the conference which in clause 38 provision was made for a 3 part system of control: Government; Facilitative mechanism; Financial mechanism. The details were very intrusive, effectively controlling national economies to achieve UN objectives. In fact a system of world government run by unelected UN officials. The draft treaty was not approved but the cat was out of the bag. For the avoidance of doubt clause 38 of the draft treaty is provided in paragraph 34 below.
34. Draft Treaty Clause 38
UN Intergovernmental Panel on Climate Change. Copenhagen 2009 Draft Treaty Clause 38; the scheme for the new institutional arrangement under the Convention will be based on three basic pillars: government; facilitative mechanism; and financial mechanism, and the basic organisation of which will include the following:
(a) The government will be ruled by the Conference of the Parties with the support of a new subsidiary body on adaptation, and of an Executive Board responsible for the management of the new funds and the related facilitative processes and bodies. The current Convention secretariat will operate as such, as appropriate. FCCC/AWGLCA/2009/INF.2 Page 19
(b) The Convention's financial mechanism will include a multilateral climate change fund including five windows:
(a) an Adaptation window,
(b) a Compensation window, to address loss and damage from climate change impacts, including insurance, rehabilitation and compensatory components,
(c) a Technology window;
(d) a Mitigation window; and
(e) a REDD window, to support a multi-phases process for positive forest incentives relating to REDD actions. (REDD, Reducing Emissions from Deforestation and Degradation)
(c) The Convention's facilitative mechanism will include:
(a) work programmes for adaptation and mitigation;
(b) a long-term REDD process;
(c) a short-term technology action plan;
(d) an expert group on adaptation established by the subsidiary body on adaptation, and expert groups on mitigation, technologies and on monitoring, reporting and verification; and
(e) an international registry for the monitoring, reporting and verification of compliance of emission reduction commitments, and the transfer of technical and financial resources from developed countries to developing countries.
The secretariat will provide technical and administrative support, including a new centre for information exchange.
The shared vision shall take the form of preambular text that encapsulates both the long-term global goal and pulls together the other elements of the agreed outcome, in the following form:
The Conference of the Parties, seeking to further implement the Convention, in light of evolving science and mindful of evolving economic development and emissions trends, recognising, in the light of Article 2 (objective) of the Convention, the importance of identifying one or more reference points in the mid-century time frame that can guide the efforts of the Parties and the international community and against which aggregate global efforts can be continually assessed, considering, in that regard, that [ ] is/are desirable global indicator(s), Having a shared vision of [summary that ties together the elements of the agreement.
35. Conclusions
1) Many peer reviewed papers have been published putting forward causes for warming other than CO2. However, what is needed to stop the madness that has seized governments around the world, and which is causing enormous misallocation of the world's resources, is a rational consideration by experts, from both sides of the argument, of the evidence for warming caused by CO2. This is a widely used technique in industry and commerce known as a Red/Blue assessment to resolve a controversial issue. This must be organised preferably independent of any government agency.
2) Consideration must also be given to the evidence of natural climate change. Until the contribution of natural change to the warming or cooling of the climate is established it is impossible to establish if manmade CO2 has any effect.
3) Recognition of the true purpose of the UN's climate change hypothesis must be publicised. See paragraph 33.
4) Withdrawal from the targets set by the 2015 Paris Conference and repeal of the Climate Change Act 2008 and subsequent legislation is now urgent.