
Reproduced with permission of Blue Anchor
In this blog I'm going to run through the main economic consequences of Brexit. After the vote to leave The Guardian started a regular tracker to chart its impact on the economy. But as the Remainer predictions relentlessly turned to dust and the good news kept piling up, they quietly dropped this feature. So I'm reviving it here to keep you abreast of all the Brex-cellent news!
First a quick note on ONS statistics. They have a habit of erring on the downside with their data releases, and then quietly revising the figures up later on, once all the data comes in, so we can expect the most recent figures to be revised up in the next few months.
We will start with trade. In 1973 Heath took us into the EEC (without even bothering with a referendum) his whole argument was that membership would help trade. We will see that, in this he was clearly wrong.
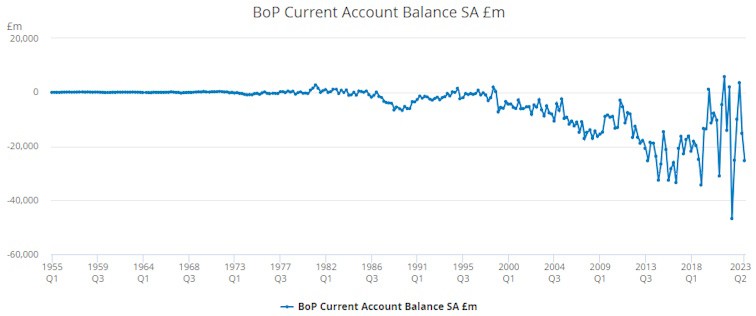
I am going to use this dataset from the ONS as it goes back to 1955 allowing us to compare generational trends. People with political motives will always prefer this or that dataset, but as we shall see they all show pretty much the same pattern. Here is the full graph:
The ONS website has a handy tool that allows us to isolate specific historical periods so here (below) is the period from 1955 (when records began) up until 1986 when Thatcher signed the Single European Act:
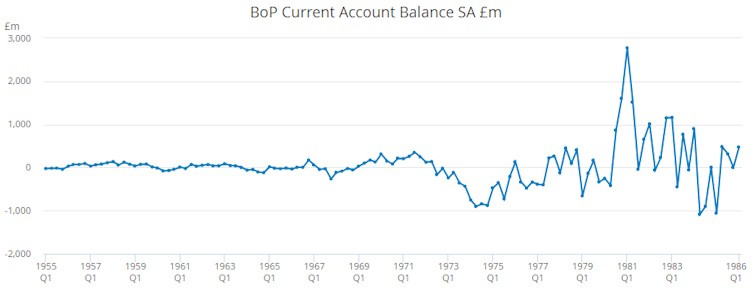
Keep your eye on the zero line. That indicates balanced trade (equal imports and exports). We see that it bounced around more as volumes increased and currency debased, but generally stuck to the zero line – we had balanced trade for three decades before Thatcher signed the Single European Act. So what happened next? This:
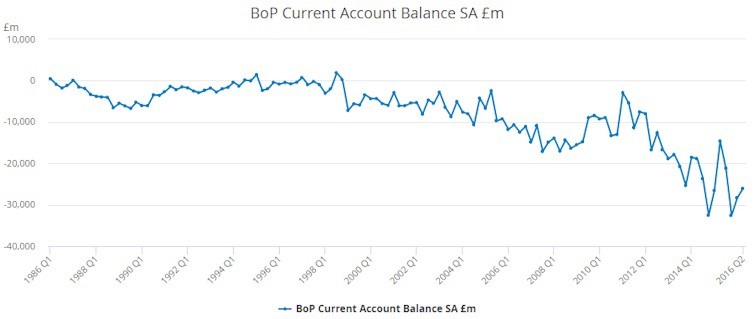
I see a line from top left to bottom right – a total absolute collapse in our current account balance as we became more integrated into the EU. From Thatcher signing the Single European Act to our vote to leave we went from balanced trade to a deficit of £27,000 million. Four decades of EU membership left the UK with a bigger trade deficit, per head of population, than the US had with China! Wasn't the whole point of membership to improve trade? So what happened next? This:
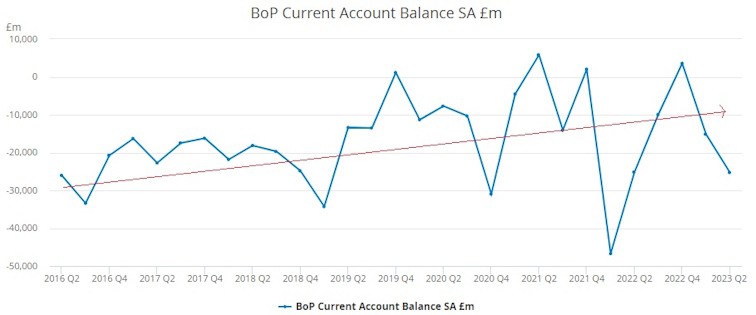
(I've drawn on the red arrow showing the general trend) We see a general upward trend of higher lows and higher highs. There was one freakily bad quarter (Q4 2021) but that probably covered the import of millions of Covid tests and vaccines, and the latest figures are disappointing but will probably be quietly revised upwards in the next few months.
If our trade balance continues to improve by £2,500,000,000 per year then we will return to permanent balanced trade in the next couple of years. Exactly the opposite of what the Remainers swore would happen!
Here are the trade figures for the last 25 years:
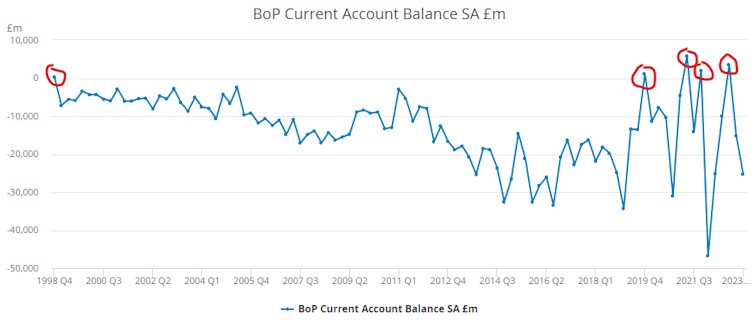
In the last quarter of a century we have achieved balanced trade 5 times (circled in red). Once in the last century, none at during the last 20 years of EU membership and four times SINCE we left the EU. Coincidence?
Trade summary:
Before joining – Good.
During membership – Collapse.
After leaving – Recovery.
We will come back to trade, but now I want to talk about unemployment. George Osborne claimed that if we dared become an independent democracy again, then 820,000 would lose their jobs. Now we have the data we can see he was making it up.
I'm going to use this dataset from the ONS if you want to check the figures for yourself. Here's the graph:
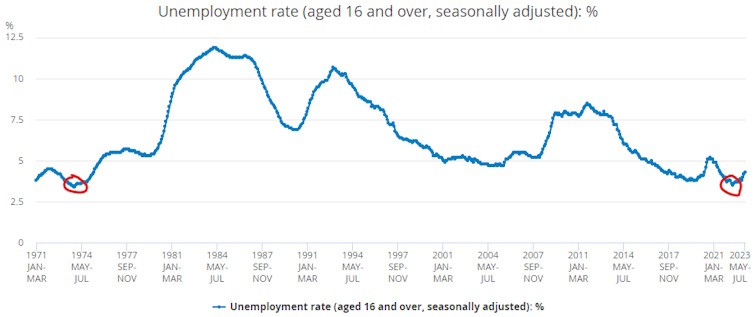
What we see from the above chart is that when we joined unemployment was 3.5% (circled in red). After we joined it tripled. Then after we left in 2020 it returned to 3.5% for the first time in nearly half a century (again circled in red). During membership unemployment averaged DOUBLE what is was before or after membership.
Here is the unemployment data since the vote to leave:
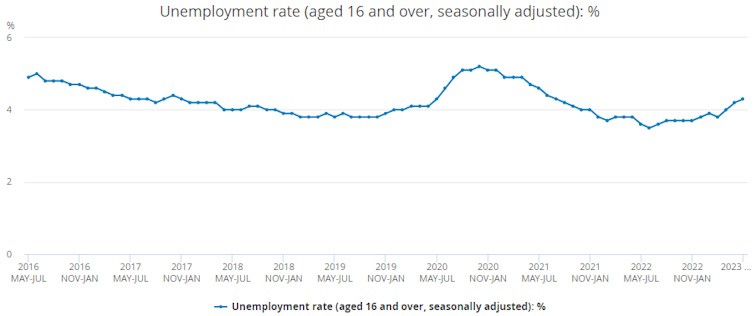
We can see the Covid blip in 2020 which we can ignore; but basically unemployment has done the exact opposite of what Remainers promised – going from 5% in when we voted to leave to about 4% now. It's up a little last month (probably due to the Ukraine war and not because we became an independent democracy again) but unemployment is still lower than when we voted to leave. We left the high unemployment club.
Here is the ONS dataset for employment:
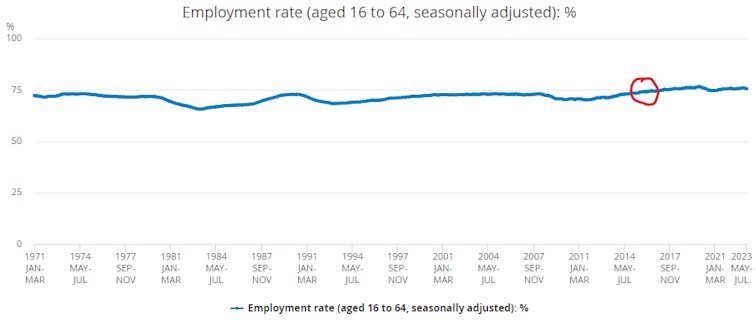
This the entire dataset covering over half a century since records began in 1971. Follow the 75% line carefully – after the vote to leave (circled in red) we broke above it for the first time ever – and stayed above it!
Employment Summary:
Before joining – Good.
During membership – Collapse.
After leaving – Recovery.
Now let's look at GDP growth. The dataset is here. Here is the whole graph:
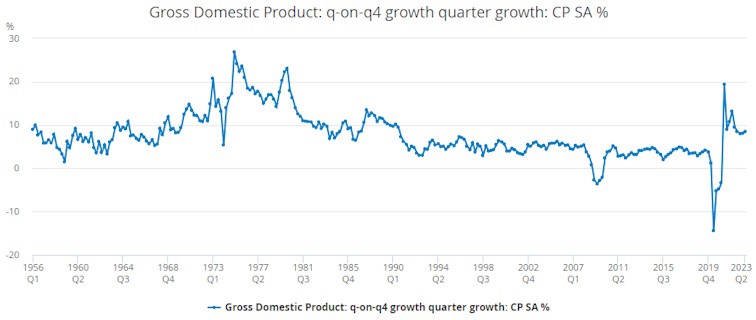
Below is the section from 1956 when records began up to the 1975 referendum vote to remain:
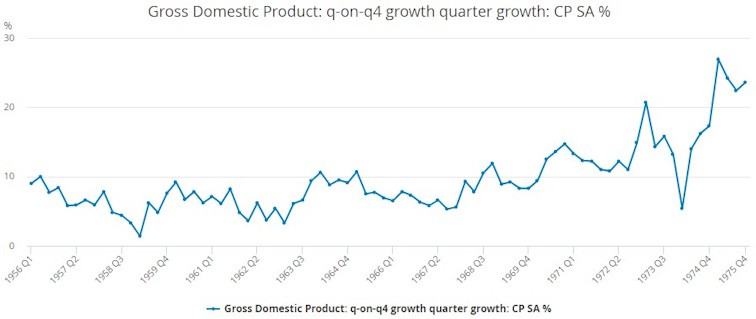
I see a line going up from bottom left to top right. GDP grew from about 8% to about 23% before membership.
This is what happened during membership:
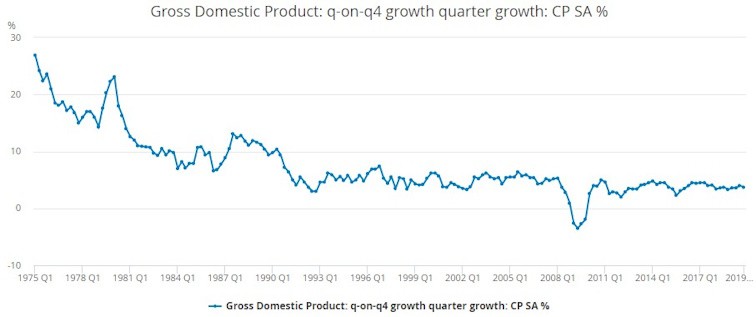
I see a line going up from bottom left to top right. GDP grew from about 8% to about 23% before membership.
This is what happened during membership:
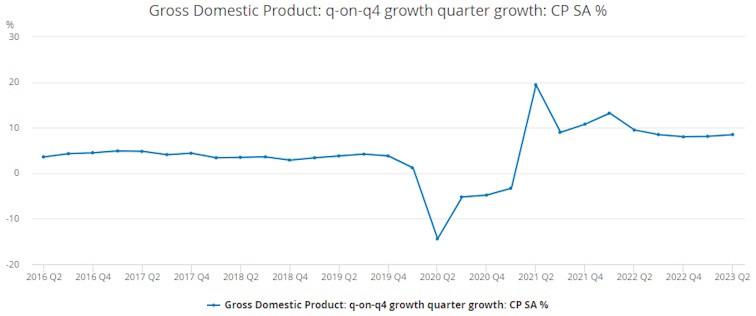
We can see the black swan of Covid in Q2 2020 which we can ignore, the salient point is, when we voted to leave GDP growth was flat-lining at 3.5%, its been more than double that for the last NINE quarters. Here is the chart for the last 30 years:
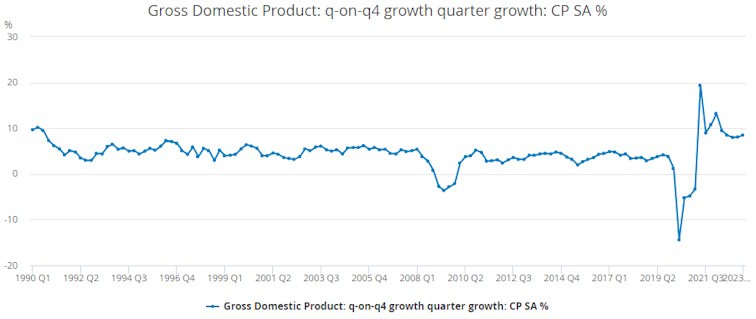
From the above graph we can see that when John Major forced the Maastricht Treaty on us (in the early nineties) it was an act of economic self-harm which ushered in decades of low growth. But for the last NINE quarters (despite Covid and Ukraine) we have had the highest GDP growth for thirty years. We left the low growth club!
GDP Growth summary:
Before we joined – Good.
During membership – Collapse.
After we left – Recovery.
Next, wages. Here is the dataset and here is the full graph:
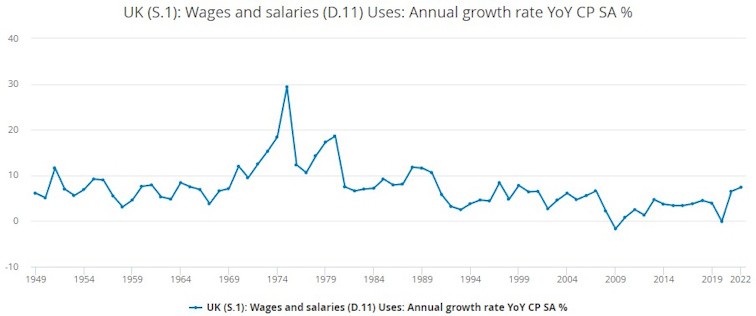
Is the general pattern starting to look familiar? Below is the section from when records begun in 1949 up to the 1975 referendum vote to remain:
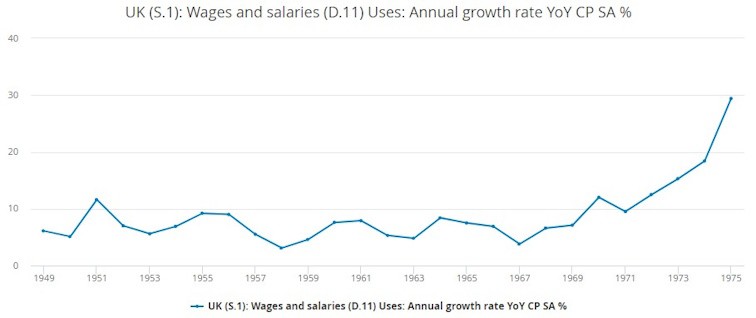
I see a line going up from bottom left to top right, with wages growing from 6% to 29%. Now let's look at what happened during membership:
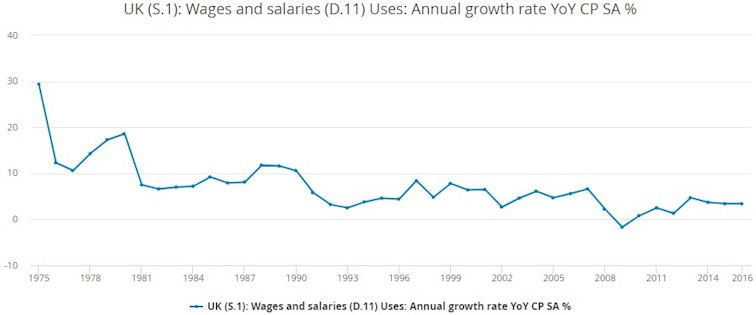
I see a line going down from top left to bottom right. During membership wages collapsed from 29% to flat-lining around 3%. THAT'S WHY WE LEFT. Now here (below) is the wages dataset from the vote to leave to now:
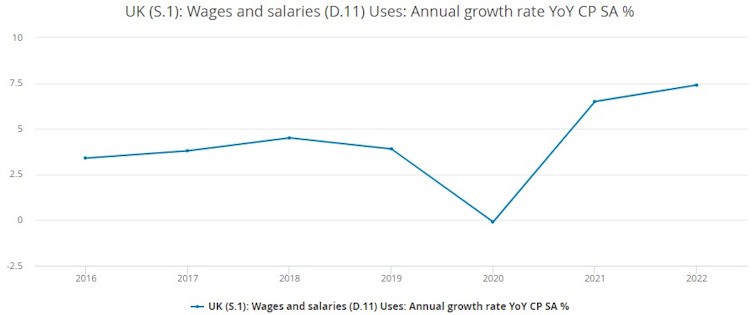
Again we can see the Covid black swan in 2020 which we can ignore; but the line goes from 3.4% to 7.4% so it's more than doubled!
Now let's look at regular pay for the whole economy. Here is the dataset and here is the graph showing average weekly earnings at the highest level since records began:
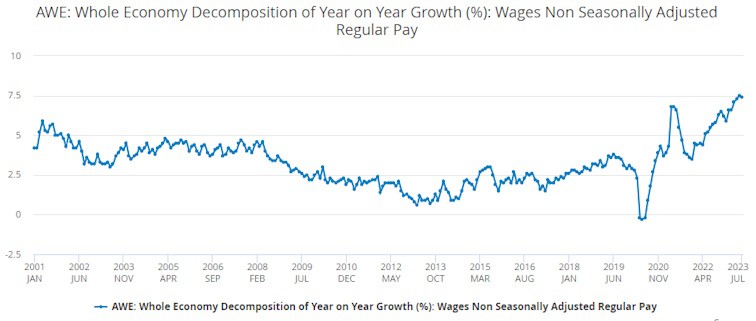
I don't like this dataset as much as it only covers 22 years of data but it basically tells the same story – wages went down before the vote to leave and up afterwards. We left the low pay club.
Wages summary:
Before we joined – Good.
During membership – Collapse.
After we left – Recovery.
Spot the pattern?
Look at the way I am arguing. I am taking a broad range of datasets and looking at the maximum time periods. This is the opposite of how Rejoiners argue – they produce fallacious arguments seeking to establish general corelations on the basis of isolated incidents.
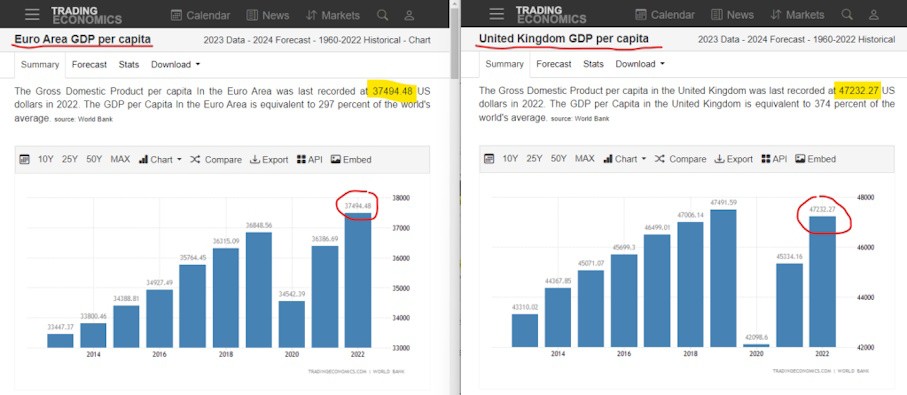
Now let's look at some more graphs, this time from Trading Economics. This one shows UK GDP per capita is 21% higher than the Eurozone – BOOM!
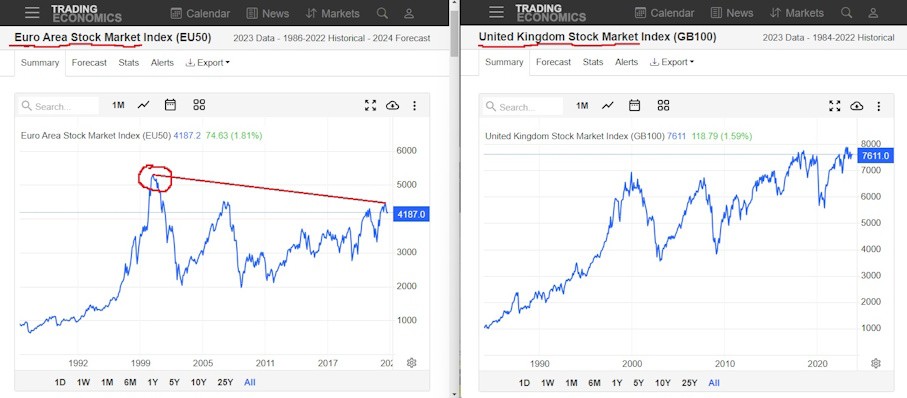
This next graph shows that while EU stocks are below where they were 23 years ago, our stock market is hitting all-time-highs. Howzat!
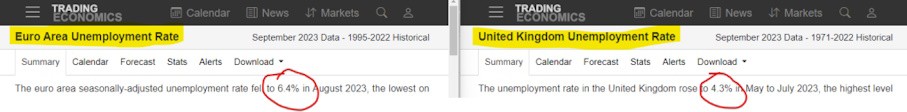
Here we see Eurozone unemployment rate is more than 2% higher than ours:
Enter your text here ...
"But what about the recession?" I hear you cry, well, wake me up when it begins to exist. Here (below) are all the GDP growth quarters since the vote to leave:
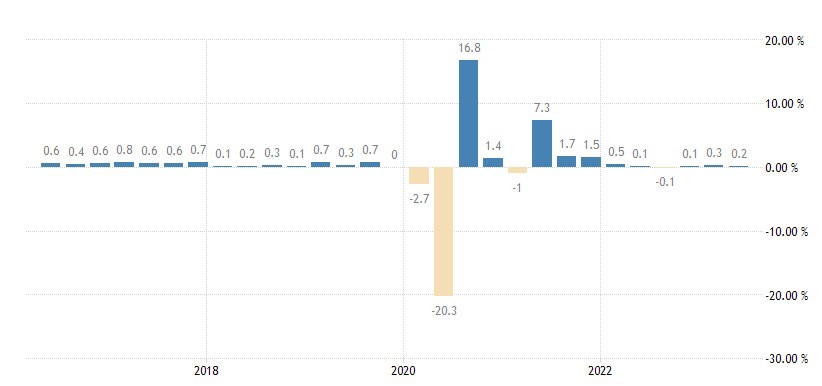
A recession is when you get two downward beige bars in a row. If there ain't two in a row there ain't a recession. Fact. Like the rest of the world we had a Covid recession in 2020, but Remainers have been fantasising about Brex-pocalypse for years now … it always seems to be just around the corner …
Next here is a comparison of UK and German GDP.
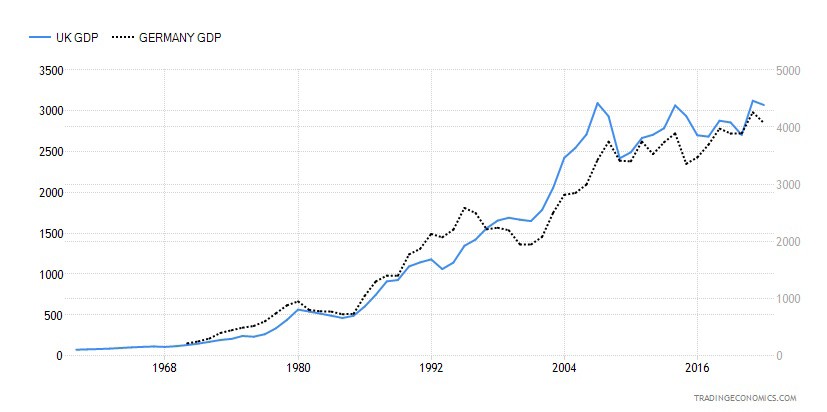
Our economy has been growing faster than Germany's for several years now. If this continues it's only a matter of time till we are once again the most powerful economy in Europe. It's all very simple, they have a failing social system and they want us to be the suckers to pay for it.
I Was Wrong!
Before Brexit I was impressed by free market arguments, but I have to respect the data and admit I was wrong. There was no Thatcherite economical miracle, it was the 60s and 70s that were the real boom decades, not the 80s. The 80s were when everything started going to shit. In the 40 years before we joined Socialism was triumphant and we had high growth, high wages, balanced trade and low unemployment. In the 40 years after we joined Capitalism was triumphant, wages collapsed, pay collapsed, the trade balance collapsed and unemployment doubled. We are frequently told that in the 70s trade unions ran the country and it was a disaster. The above shows that is not the case. We have reverted to a pre-EU political system so naturally we have reverted to a pre-EU social system too, with working people demanding (and getting) higher pay. That's not a problem, that's a solution! The current wave of industrial action doesn't prove Brexit is failing – it proves Brexit is succeeding!
All the above is a statement of the obvious. When we look around the world at country after country, decade after decade, we see that when more people have more democratic control over more power, there is more prosperity. The offer of the EU is the opposite. The EU only offers us a system in which a small number of ideologically pure appointees decide things in secret. When in history has that not failed? Basically they are a church, like the WEF, IMF, OECD, central banks, civil service, BBC etc.
100 years ago there were about 100 countries in the world, now it's about 200. So counties are becoming greater in number and smaller in size. Why? Self-interest. The closer the corelation between democracy and power, the more prosperity will inevitably ensue.
Here are the macro arguments for leaving the EU:
The next two graphs show how leaving the Single Market makes us richer. This first one shows the long-term decline of global tariffs:
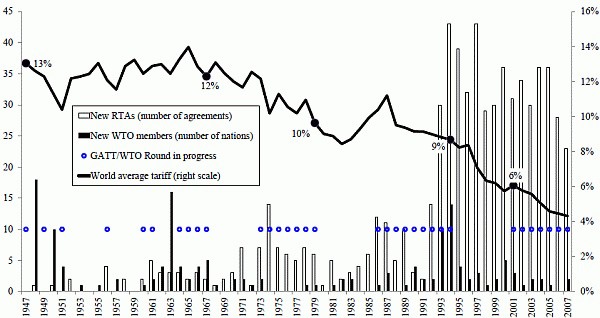
So, tariffs are clearly in a death spiral. Now here is a graph showing our EU membership contributions went up and up…
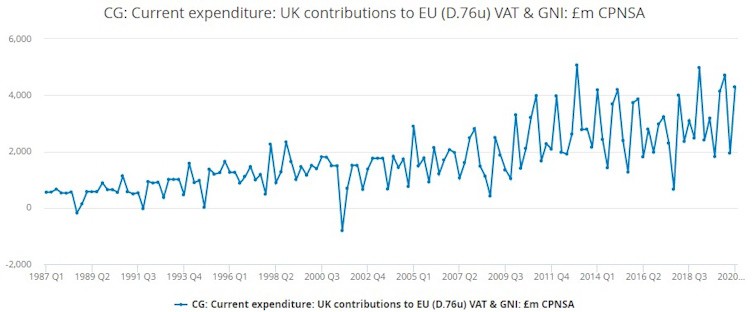
There is no such thing as free trade with the EU. We either:
A, Pay a membership fee and no tariffs. Or …
B, Pay tariffs and no membership fees.
It's one or the other. So why would we want to pay membership fees that are going up and up when we could pay tariffs that are going down and down? The obvious answer is that we wouldn't – unless of course we wanted to make ourselves poorer for the sake of some irrational ideological belief. Clearly paying tariffs would make us richer than paying EU membership fees. Doubly so when we consider that the whole of society has to pay the membership fees whereas tariffs are optional – the only people who have to pay them are the 6% of British companies that export goods (not services) to the EU. So if you don't feel like paying the tariffs, fine, just buy and sell locally instead. Simple! EU tariffs amount to less than half of UK membership contributions – that's automatic saving of around £5bn per annum. Could there be a more clear-cut argument for paying tariffs rather than membership fees? But all the while the Remain side tried to get people to conflate membership with prosperity by repeating phrases like "We want tariff-free trade". It was an exercise in deception.
Next here is a map I knocked up:
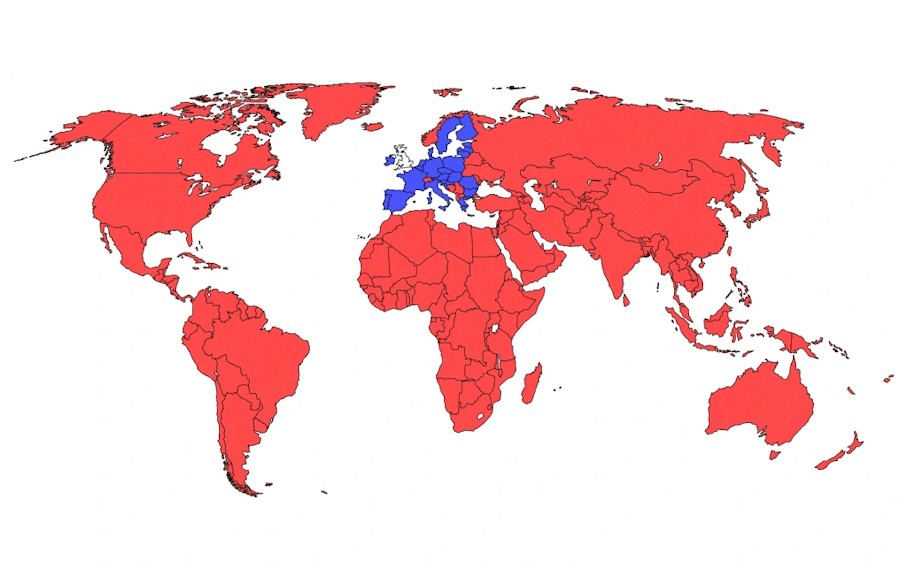
Let's call the blue area 'The EU Market' and the red area 'The World Market'. Which market should we be concerned about? The small one with low growth, or the big one with high growth? We can either:
A, Lock ourselves into the small, low growth EU market which will make goods from the world market more expensive and prevent us from doing any trade deals. Or…
B, Not lock ourselves into the EU market, in which case we can trade how we like, with whoever we like, whenever we like.
It's not a tough choice.
So we see there is a clear corelation between democracy and prosperity. As voter's ability to control laws (re goods, services, labour and capital) declines, so their prosperity declines accordingly. This should be a statement of the obvious. No political system succeeds more and fails less than democratic self-rule. So when Remainers said "We didn't vote to become poorer" they were actually right! Our vote to leave was a pragmatic choice to revert to a benign political system that has worked around the world for decades and which was working fine for us up untill 1975. And when Nigel Farage says "Britain is broken" he is clearly wrong, the government may be broken but the country itself seems to be in rude health!
Obviously the Tories and BoE are trying to make the country as mediocre as possible, I wouldn't expect anything else, but the thing the Tories have got right is that they have completely collapsed. They're not even pretending to be running things. Well they may have given up taking back control but the people haven't! Before our vote to leave a shit PM could expect to stay in Downing Street for a few years, now its months (and in the case of Liz Truss – days!) At last after decades of them telling us how it's going to be, the boot is on the other foot. Don't want to pay higher fuel bills? Then threaten not to and they will cave in! Want higher pay? Demand and you will get! Before the vote to leave we were scared of what they would do, finally it is the other way round. This is a nation reborn!
During Covid the M2 money supply increased globally by around 40% which naturally increased prices, which in turn increased interest rates. EU supporters are pissing their pants to attribute any bad consequences of this to the UK becoming an independent democracy again. EU supporters are great at sneering and adopting a haughty air of superiority; they are less good at explaining why their precious EU has gone into recession but the UK hasn't. Our economy is growing, theirs isn't. Suck it up losers.
Voters in the EU have no democratic control (over laws regarding goods, services, labour or capital) so naturally they decline. Here is a graph I put together illustrating the general economic decline of EU member states:
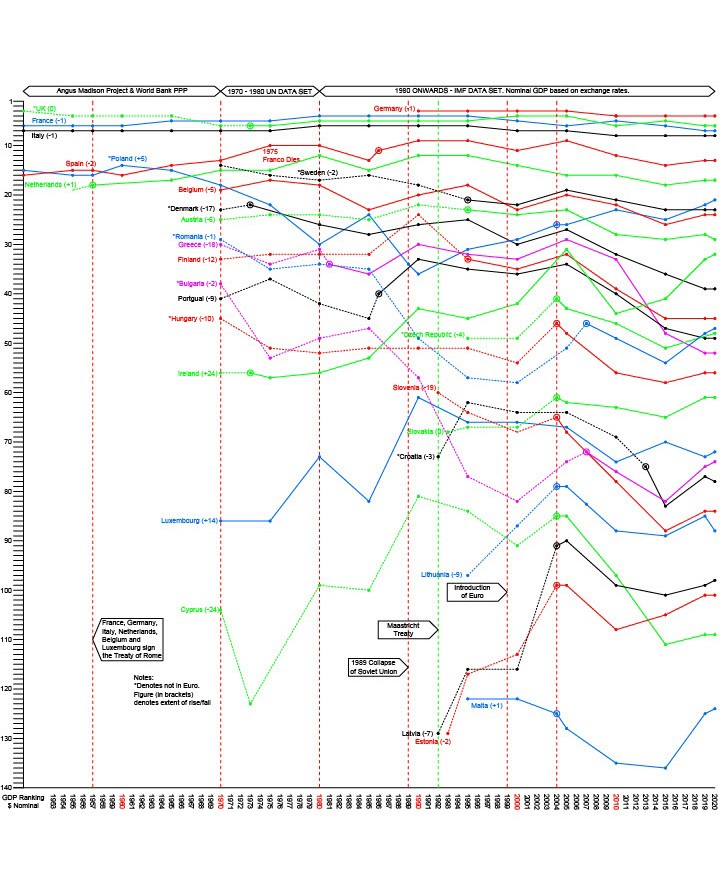
To establish general correlations I have used the longest-term economic data I could find. The data up to 1970 is Angus Madison Project & World Bank PPP. The dataset from 1970 to 1980 is from the UN and from 1980 onwards I used IMF GDP based on exchange rates.
The lines represent the world ranking of member states by GDP.
The dashed lines show the trend before accession.
The joining dates are circled.
The continuous lines show the trend after accession.
By the name of each country I noted the number of places it rose or fell during membership.
We see the general decline from left to right. As member states became more integrated (less democratic) they tended to drop down the table. If you can't see the detail at this scale I will talk you through the data. From top to bottom:
Since unification, Germany (red) has declined from 3rd to 4th place.
Since the Maastricht Treaty, France (blue) has declined three places.
Italy (black) has dropped from 6th to 8th over the same period.
Spain (red) was doing well in 1985. After joining in 1986 it carried on growing, but at a slower pace. Since Maastricht Spain has fallen from 9th to 13th.
Since Maastricht, Holland (green) has dropped from 12th to 17th.
Since joining Sweden (black) has dropped from 21st to 23rd.
In 1950 Poland (blue) was 15th and on the way up the rankings! But from 1960 it steadily declined until the fall of communism in 1989. 1990 was its lowest point. After 1990 Poland steadily rose up the rankings. It joined the EU in 2004 and the ascent slowed slightly. But clearly the thing that transformed Poland's economy was leaving the Soviet Union, not joining the European Union. Also Poland has not been damaged so much by EU membership as it is not in the Euro, and is a net recipient of EU funding.
Denmark (black) was on the up before joining in 1973, it then crashed 17 places.
Austria (green) was also on the up until it joined in 1995, then it crashed 6 places.
Romania (blue) declined under communism, revived after communism and has declined one place since joining.
Greece (magenta) has crashed 18 places since joining.
Finland (red) has crashed 12 places since joining.
Bulgaria (magenta) is similar to Romania, it declined under communism, revived after communism then fell two places since joining.
Portugal (black) dropped 9 places since joining.
Hungary (red) was steady for 34 years before joining, but dropped 10 places in the 16 years after.
Then Ireland! (in green obviously) The one country to totally buck the trend! On a rollercoaster, but up 24 places since joining! When the one country that is part of the Anglosphere does so much better than the countries that are not, we have to wonder whether it is membership of the Anglosphere that made the difference rather than membership of the EU.
Czech Republic (green) up 8 places in the 9 years before joining, and down 7 places in the 16 years after.
Slovenia (red) down 19 places since joining.
Slovakia (green) up 7 places in the 11 years before joining. No change in the 15 years after joining.
Croatia (black) down 3 since joining.
Luxembourg (blue) up 14 places, good. But it should be noted that Luxembourg started from a low point when the dataset began in 1970. Over the last 30 years as integration accelerated it has dropped 11 places.
Lithuania (blue) went up 18 places in the 9 years before joining. Went down 9 places in the 16 years after joining.
Cyprus (green) went up 19 places in the 34 years before joining. Went down 24 places in the 16 years after joining.
Latvia (black) up 38 places in the 12 years before joining and down 7 in the 16 years after.
Estonia (red) up 30 places in the 11 years before joining and down 2 in the 16 years after.
And finally Malta (blue) is still 2 places below where it was before joining.
The general approximate conclusions we can draw, from these empirical observations of many countries over many years, are as follows:
1, In virtually every instance EU member states are going down the rankings.
2, Membership of the block does not generate prosperity.
3, If there is any political event that has generated prosperity for the countries shown, it was leaving the Soviet Union, not joining the European Union.
It's all very very simple: as EU member states became less independent and less democratic, they became poorer. THEY'RE. GOING. DOWN.
Inductive Reasoning
With all the above, in order to avoid getting mislead by isolated incidents, I have chosen a broad range of datasets, which span the maximum historical period, for the whole economy. This is called inductive reasoning (from Francis Bacon 1561-1626) it works by identifying patterns from the broadest possible information.
We have seen from the above table of GDP for various countries, that the UK was damaged by membership far less than say Greece, Portugal or Denmark. So why were we so quick to leave? (the second after Greenland left the EEC in 1979) I think the answer is our culture of empiricism (From Bacon, Locke and Hume etc).
All pro EU arguments seek to advance authoritarianism by using one of the following types of fallacious argument:
1, Conjecture about the future.
2, Personal opinions about the character of individuals.
3, Trying to demonstrate general corelations using specific examples.
4, Siting reports produced by EU-funded organisations.
5, Attempting to compare that which can be observed to something that can only be speculated about. For example 'such-and-such would be better if we had stayed'.
Spot the pattern? Maximum subjectivity. Pro-EU arguments generally reveal a contempt for empiricism and inductive reasoning.
Conclusion
Overall it's hard to imagine a more clear-cut case for leaving. Before we joined we had balanced trade, strong pay rises, high GDP growth and low unemployment. After we joined, our trade balance collapsed, GDP growth declined 80% unemployment tripled, pay rises stopped; inequality increased and so did debt. EU supporters manically asserted that the EU had given the UK prosperity when it was clearly the other way round. We imported their goods which damaged our manufacturing base. We imported their unskilled labour which depressed wages, we imported their skilled labour (which was good but) which meant our employers could close their training schemes. And finally we paid ever increasing membership fees. And for what? To save a diminishing tariff on a diminishing number of exports! But all the while EU supporters swore blind it was the Brexiteers who were economically illiterate. They were stuck stuck stuck in an oxymoronic alternative reality in which we could somehow have the pre-admission flourishing society with the post-admission shit political system.
In the years after the vote to leave, despite the fact that we were governed by a manifestly incompetent and corrupt government, implacably opposed to making a success of Brexit, our economy slowly but surely debunked all of the lurid predictions of the Remainiacs. For them Brex-pocalypse is always just around the corner. No one who values empiricism can read the above and ridicule the economic case for leaving. But of course, that is the whole point – the people we are dealing with are not empiricists.
Imagine … just imagine if it were the other way round. Imagine if our trade balance improved DURING membership! Imagine if unemployment was lower DURING membership! Imagine if pay went down AFTER we left! Imagine if GDP went down AFTER we left! Imagine if our unemployment was higher than theirs! Imagine if we were in recession and they were not! Imagine if their stock market was hitting all-time-highs and our was below where it was 20 years ago! Imagine if EU member states were rising UP the world GDP rankings! That would constitute an argument for membership right? But none of those things are the case, so naturally, that vindicates us being an independent democracy … right?
My challenge to EU supporters. either:
A, Finally produce a factual argument why we should not be an independent democracy. Or,
B, Apologise.
If you want to read more about this, I recommend a book called 'Brexit, Kant and Othello' by S.James.
Enter your text here ...