Bruges Group Blog
UK debt and the sword of Damocles
The general public has little idea of how much debt hangs over our heads.
Today, Laura Perrins warns us that government borrowing is now equivalent to 99.2% of GDP (i.e. a whole year's worth of national economic activity); but that is only the tip of the iceberg, because it is only looking at public sector borrowing.
Unlike the UK, where valuable financial information is treated like a dirty family secret, the US Federal Reserve also keeps track of ALL debt in the system, both public and private. As at Q4 of 2022 US Total Credit Market Debt Outstanding (TCMDO) was $93.497 trillion while US GDP was $26.137 trillion; so, a debt-to-GDP ratio of 358%. That is a major deterioration from twelve years ago, when US debt-to-GDP was already a lamentable 279%.
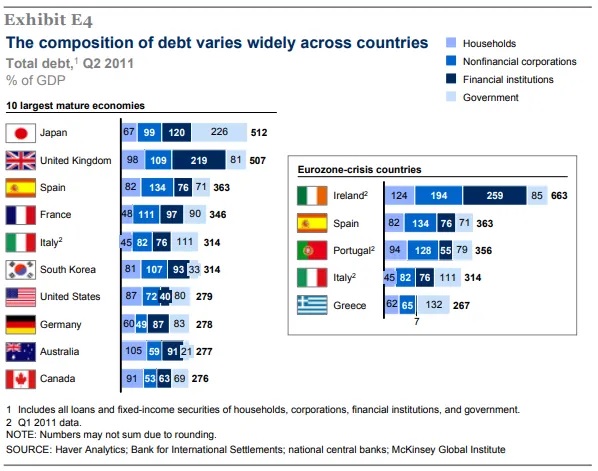
But if you think that was bad, consider that even then (Q2 2011) the British position was much worse: 507% according to this McKinsey report. As per their graphic below, we were then almost exactly as badly off as Japan, which has been bog-snorkeling through a debt quagmire since the early 1990s.
What would the UK's plight look like now, if we were permitted to see it?
As for the EU that so many right-thinking people want us to re-join, the finances are even more opaque. Bruge Group contributor Bob Lyddon showed us two days ago that underneath the visible liabilities of the Union lies another €10 trillion-plus at risk, equivalent to a submerged extra c. 64% of GDP.
In ancient times there was a periodic Debt Jubilee to clear the system. I don't know if and how it could work today, but without it we in the West have to pray that the thread suspending the sword above us doesn't snap.
Contact us
246 Linen Hall, 162-168 Regent Street
London W1B 5TB
Director : Robert Oulds MA, FRSA
Founder Chairman : Lord Harris of High Cross


